Break Even Analysis: Break-Even Charts

 Break even analysis is perhaps one of the most important aspects of the Accounts and Finance section of Module 1. Let’s start with a definition of break even.

Break Even- Break even is the point at which a company’s Revenue is equal to their Total costs and as a result the point at which the company is making neither a loss nor a profit.

In your exam you could be asked to draw what’s called a Break Even Chart which looks a bit like this:


This at the moment probably means nothing to you but 
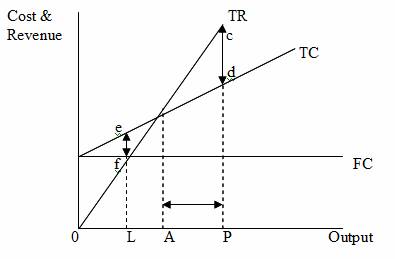
this description should help to clear things up: 

  • The Break- even output is at ‘A’  (See calculating Break even output) 
  • The distance ‘AP’ represents the margin of safety if the firm is producing at ‘P’ 
  • The distance ‘cd’ represents the profit made if output is at ‘P’ 
  • The distance ‘ef’ represents the loss made if production is at ‘L’ 
  • FC is Fixed Costs 
  • TC is Total Costs 
  • TR is Total Revenue


Calculating Break-Even Output

To begin with it’s probably worth defining exactly what Break Even Output is. Break even output is the level of production (output) that a company needs to reach for revenue to equal costs.

In the exam you may be asked a question which involves you calculating Break Even output. So it’s a good idea to learn these next few formulas.

Calculating BEO revolves around the concept of contribution. Contribution is basically

The amount of money left over once variable costs have been covered.


For Break Even Output we need to know a slightly more specific form of contribution which is called Contribution per unit. This is worked out as follows:                                    

Contribution per unit = Price – Average Cost
                               (Revenue per unit) – (Cost per unit)


Note: Average cost is sometimes called variable cost per unit as well.

This contribution is then used to pay off all fixed costs and once this has been done contribution goes towards profit.


Now your ready for the Break even output formula- brace yourselves it’s a bad boy.

 Break Even Output = Fixed Costs
                            Contribution per unit


Here’s a quick example. Price = £17     Average Cost = £9     Fixed Cost =£1456

Break Even Output = 1456 / (17 - 9) =  1456 / 8   = 182 Units
 

This means that for this particular product to break even 182 will have to be sold.